

Volume 13, Issue 3 (9-2025)
J Surg Trauma 2025, 13(3): 111-119 |
Back to browse issues page


Ethics code: IR.BUMS.REC.1402.024
Download citation:
BibTeX | RIS | EndNote | Medlars | ProCite | Reference Manager | RefWorks
Send citation to:


BibTeX | RIS | EndNote | Medlars | ProCite | Reference Manager | RefWorks
Send citation to:
Ramezani-DashteBayaz A, Mohammadi Far M, Talebi F, Maleki Z, Sarmadi M, Pandesh S. Evaluation of Dose Area Product in Intraoperative Radiography during Orthopedic and Neurosurgical Procedures. J Surg Trauma 2025; 13 (3) :111-119
URL: http://jsurgery.bums.ac.ir/article-1-482-en.html
URL: http://jsurgery.bums.ac.ir/article-1-482-en.html
Asiye Ramezani-DashteBayaz 
 , Mahyar Mohammadi Far
  , Fatemeh Talebi , Zahra Maleki , Maliheh Sarmadi , Sajjad Pandesh *
, Mahyar Mohammadi Far , Fatemeh Talebi , Zahra Maleki , Maliheh Sarmadi , Sajjad Pandesh *
Department of Radiology Technology, School of Allied Medicine, Birjand University of Medical Sciences, Birjand, Iran
Full-Text [PDF 793 kb]
(502 Downloads)
| Abstract (HTML) (1569 Views)
Age
As illustrated in Figure 7 and Table 3, the highest DAP values were measured in the 36–50 age group (mean: 15.80±8.86 μGy·m²; range: 6.94–24.66 μGy·m²), while the lowest values were observed in the 21–35 age group (mean: 2.58±1.70 μGy·m²). The mean DAP values for age groups <11 years and 12–20 years were 3.23±1.99 μGy·m² and 4.88±2.67 μGy·m², respectively. No statistically significant difference was found in DAP values across age groups (P=0.077).
Gender
As shown in Figure 8, the majority of patients in the study were male. The mean DAP values were 8.84±3.88 μGy·m² (range: 4.96–12.72 μGy·m²) in males and 7.97±3.86 μGy·m² (range: 4.11–11.83 μGy·m²) in females. No statistically significant difference was observed between males and females in terms of DAP values (P=0.556).
Table 3. Mean±SD of measured DAP values across different age groups
Discussion
This study evaluated 123 patients, of whom 89 were male and 34 were female. In Orthopedic Operating Room 1, the mean DAP was 0.96±0.66 μGy·m² with an average exposure time of 4.73±0.74 seconds, while in Orthopedic Operating Room 2, the mean DAP was higher at 1.67±1.22 μGy·m² (exposure time: 4.45±2.08 seconds). These findings contrast significantly with those of Lee et al. (2015) (19), who reported a mean DAP of 0.27±0.57 mGy·m² despite substantially longer exposure times (78.53 seconds). Notably, our values were markedly lower, with Orthopedic Room 1 showing 281.25-fold lower and Orthopedic Room 2 showing 161.67-fold lower DAP values than those reported by Lee et al.
In neurosurgical procedures, the mean DAP was 33.27±15.89 μGy·m² with an average exposure time of 1.93±1.20 seconds. By comparison, Lee et al. (2015) (19) reported 0.95±0.94 mGy·m² with an exposure time of 82.43 seconds, which was 28.55-fold higher than our neurosurgical values. Overall, a statistically significant difference (P<0.001) was observed between DAP values in Orthopedic Operating Rooms 1 and 2 and the Neurosurgery Operating Room. This discrepancy is clinically justified, as lumbar procedures (predominantly performed in the Neurosurgery Operating Room) inherently require higher DAP than peripheral orthopedic cases. Greater tissue density in spinal anatomy necessitates increased radiation, and most neurosurgical interventions targeted the lumbar region, whereas orthopedic cases mainly involved the extremities.
In addition to surgical site differences, patient-specific factors, such as BMI, significantly influenced DAP values. Our results demonstrated that DAP increased with BMI (P=0.023): BMI <18, 1.38±1.53 μGy·m²; BMI 18–25, 3.52±8.26 μGy·m²; BMI 25–30, 4.61±9.09 μGy·m²; BMI >30, 18.43±21.84 μGy·m². A strong correlation (r=0.49, P=0.01) was observed between BMI and DAP in pelvic/femoral procedures, consistent with Baratz et al. (20) (r=0.45, P<0.001) and Bratschitsch et al. (2019) (21) (r=0.80, P=0.01). These findings confirm that patient habitus is a critical determinant of radiation exposure during intraoperative imaging.
By contrast, no significant age-dependent variation in DAP was found in this study (P=0.077). The highest values occurred in the 36–50-year age group (15.80±8.86 μGy·m²), while the lowest were in the 21–35-year group (2.58±1.70 μGy·m²). Values for patients younger than 11 years and those aged 12–20 years were 3.23±1.99 μGy·m² and 4.88±2.67 μGy·m², respectively. These results differ from those reported by Ghayoursaffar (2023) (1), Billinger (22), and Roch (2012) (23); however, they are in line with the findings of Baratz et al (20) (multivariate coefficient: 1.8, P=0.56). The discrepancy may be explained by the fact that the former studies primarily focused on pediatric populations, in which age has a more substantial influence on anatomy and radiation absorption.
Taken together, our findings underscore the importance of carefully optimizing radiation dose while maintaining image quality. Since no universal DAP standards exist for intraoperative radiography, dose management should consider patient-specific factors, such as body habitus, surgical site, and equipment performance. Implementing dose-reduction protocols, adjusting field size, and using protective measures remain essential strategies to minimize unnecessary exposure for both patients and operating room staff.
Conclusions
This study provides valuable insights aimed at enhancing surgeons’ awareness and reducing their exposure to ionizing radiation. The findings indicate that factors, such as the anatomical site of surgery, patients' BMI, and the type of surgical procedure significantly influence the average DAP. It is highly recommended that, particularly during procedures involving the spinal cord, pelvis, or femur, surgical team members utilize protective measures, such as wearing lead aprons or positioning themselves behind lead shields whenever feasible.
Given the potential health risks associated with intraoperative radiation exposure, surgical personnel must be adequately informed and adopt effective protective strategies. The routine use of personal dosimeters is strongly advised for accurate monitoring and dose optimization. Moreover, surgeons bear the responsibility of ensuring comprehensive radiation protection protocols are in place for both patients and operating room staff.
Funding
This research was fully funded by Birjand University of Medical Sciences, Birjand, Iran.
Conflict of Interest
The authors declare that there is no conflict of interest.
Full-Text: (494 Views)
Abstract
Introduction: Despite the necessity of C-arm and other X-ray imaging devices in operating rooms (ORs) and interventional procedures, awareness of their proper and safe usage remains limited. Comprehensive education regarding the risks and adverse effects of X-ray exposure has not been adequately provided. This study aims to assess the Dose Area Product (DAP) and, consequently, the radiation dose delivered to patients based on various influencing factors.
Methods: This descriptive-analytical cross-sectional study involved 123 patients undergoing orthopedic and neurosurgical operations at Imam Reza Hospital, Birjand, Iran. Patient demographic information, including height, weight, gender, age, and type of surgery, was recorded confidentially from medical files. Imaging parameters, such as kVp, mAs, distance from the source, and the number of radiographs, were also documented. DAP values were measured at the C-arm output using recorded parameters without altering imaging protocols. Measurements were obtained without patient presence, preventing additional radiation exposure. Data were analyzed using t-test, ANOVA, Mann–Whitney U, Kruskal-Wallis, and Pearson’s correlation coefficient.
Results: This study analyzed DAP in 123 surgical patients (89 male, 34 female) across three ORs. Neurosurgical procedures indicated significantly higher DAP (33.27±15.89 µGy·m²) versus orthopedic cases (0.96-1.67 µGy·m², P<0.001). Lumbar surgeries required 20.8-22.2 µGy·m² more radiation than peripheral regions after age/BMI adjustment. Higher BMI associated with higher DAP (18.43±21.84 µGy·m² for BMI >30 vs 1.38±1.53 µGy·m² for BMI<18, p=0.023). No significant age or gender differences were observed (P>0.05). Equipment variations among ORs significantly affected radiation output despite similar procedures.
Conclusion: This study highlights key factors affecting surgical radiation exposure, including anatomical site, BMI, and procedure type. Spinal, pelvic, and femoral surgeries require particular caution, emphasizing lead apron use and shielding. Strict protection protocols are strongly recommended to minimize risks for both staff and patients, ensuring safer operative environments.
Key words: Neurosurgical Procedures, Orthopedic Procedures, Radiation Dosage, Radiography, Surgery
Introduction
With the continuous advancement of science and technology, X-ray radiation plays a pivotal role in diagnosing and treating numerous diseases, especially in emergencies. The C-arm device provides real-time, high-resolution X-ray imaging, allowing for dynamic observation and timely corrections during procedures. It offers advantages, such as low radiation dose, high image quality, and consistent performance (1, 2). C-arm fluoroscopy is commonly used in orthopedic surgeries (e.g., screw and plate placement, checking prosthesis position), neurosurgical procedures (e.g., spinal and cervical interventions), urology surgeries, pacemaker insertions, foreign body removals, and more (3, 4). Despite its benefits, X-ray imaging carries inherent risks, particularly due to ionizing radiation. Physicians must be aware of these hazards and adhere to radiation protection principles (5). Unjustified or improper use can elevate the associated risks. Inadequate radiation protection, especially for sensitive populations (i.e., children and women of reproductive age), is often overlooked, particularly when procedures are performed by less experienced residents, leading to excessive exposure (6).
Studies have confirmed that X-rays can cause cataracts, genetic mutations, congenital abnormalities, and miscarriage. Radiation adversely affects bone marrow, lymphatic tissue, thyroid, testes, and ovaries. Occupational exposure in the operating room also poses serious risks to medical staff. Fortunately, these complications can be prevented mainly through proper protective techniques (7-9). According to the ALARA principle, imaging procedures should be justified, and radiation doses should be kept as low as reasonably achievable without compromising diagnostic quality (10).
The Dose Area Product (DAP), expressed in Gy·cm², is a metric that reflects both the dose and the irradiated tissue area. It is considered a more reliable indicator of the overall cancer risk, compared to dose alone. DAP is also easily measurable and can be used to estimate the entrance skin dose (1). Patient absorbed dose from radiological exams during surgeries can vary up to tenfold, depending on such factors as imaging protocol, fluoroscopy time, patient weight, age, gender, device type, and operator experience (11). The Linear No-Threshold model, which assumes that even low radiation doses increase cancer risk, is commonly used in radiation risk assessments (12, 13). Based on this model, three main principles govern radiation protection: the justified use of radiation sources, dose optimization, and minimizing occupational exposure duration (7, 9, 14).
This study was conducted to evaluate intraoperative DAP values across different surgical procedures and anatomical regions and to analyze how factors, such as BMI, age, and gender, influence radiation dose during surgery.
Methods
The study protocol was approved by the Research Ethics Committee of Birjand University of Medical Sciences, Birjand, Iran (IR.BUMS.REC.1402.024).
Initially, factors potentially influencing patient absorbed dose and DAP were categorized. These included patient-specific information (age, gender, BMI, type of surgery, anatomical region of surgery), type of imaging equipment in the operating rooms at Imam Reza Hospital (Orthopedic Operating Room 1, Orthopedic Operating Room 2, and Neurosurgery operating Room), and imaging parameters (kVp, mA, exposure time, number of images, and focus-to-skin distance or FSD).
The population of this descriptive-analytical cross-sectional study consisted of 123 patients who underwent surgery in the operating rooms of the Imam Reza Hospital affiliated with Birjand University of Medical Sciences, Birjand, Iran, and received at least one intraoperative radiographic image. Inclusion criteria required patients to have undergone surgery with a minimum of one radiographic exposure during the procedure. Eligible patients were enrolled in the study after meeting the inclusion criteria. This study did not define any exclusion criteria explicitly.
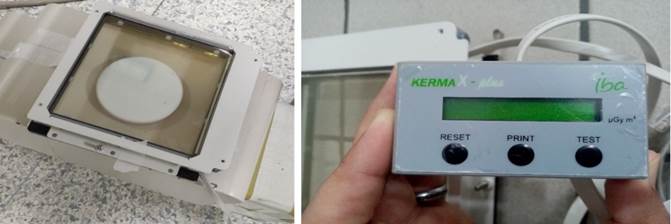
The researcher carried out data collection. To measure the DAP, a KermaX® plus SDP DAP meter manufactured by IBA was utilized (Figure 1). Initially, data collection forms were prepared, which included all data mentioned previously. All forms were anonymized and did not include patient names.
After data collection, the DAP meter was attached to the output of the C-Arm equipment. The radiation exposure settings were configured to match the recorded parameters, and the corresponding DAP values were then measured. It is important to emphasize that no changes were made to the patients’ imaging protocols. Furthermore, the DAP measurements were conducted without requiring patient presence, ensuring no additional radiation exposure occurred. The DAP meter was an external device and had been calibrated prior to measurements according to the manufacturer’s standards.
The C-arm systems used in this study included: SHIMADZU (Japan) in Orthopedic Operating Room 1, APELEM (France) in Orthopedic Operating Room 2, and EcoRay (South Korea) in the Neurosurgery Room.
With the continuous advancement of science and technology, X-ray radiation plays a pivotal role in diagnosing and treating numerous diseases, especially in emergencies. The C-arm device provides real-time, high-resolution X-ray imaging, allowing for dynamic observation and timely corrections during procedures. It offers advantages, such as low radiation dose, high image quality, and consistent performance (1, 2). C-arm fluoroscopy is commonly used in orthopedic surgeries (e.g., screw and plate placement, checking prosthesis position), neurosurgical procedures (e.g., spinal and cervical interventions), urology surgeries, pacemaker insertions, foreign body removals, and more (3, 4). Despite its benefits, X-ray imaging carries inherent risks, particularly due to ionizing radiation. Physicians must be aware of these hazards and adhere to radiation protection principles (5). Unjustified or improper use can elevate the associated risks. Inadequate radiation protection, especially for sensitive populations (i.e., children and women of reproductive age), is often overlooked, particularly when procedures are performed by less experienced residents, leading to excessive exposure (6).
Studies have confirmed that X-rays can cause cataracts, genetic mutations, congenital abnormalities, and miscarriage. Radiation adversely affects bone marrow, lymphatic tissue, thyroid, testes, and ovaries. Occupational exposure in the operating room also poses serious risks to medical staff. Fortunately, these complications can be prevented mainly through proper protective techniques (7-9). According to the ALARA principle, imaging procedures should be justified, and radiation doses should be kept as low as reasonably achievable without compromising diagnostic quality (10).
The Dose Area Product (DAP), expressed in Gy·cm², is a metric that reflects both the dose and the irradiated tissue area. It is considered a more reliable indicator of the overall cancer risk, compared to dose alone. DAP is also easily measurable and can be used to estimate the entrance skin dose (1). Patient absorbed dose from radiological exams during surgeries can vary up to tenfold, depending on such factors as imaging protocol, fluoroscopy time, patient weight, age, gender, device type, and operator experience (11). The Linear No-Threshold model, which assumes that even low radiation doses increase cancer risk, is commonly used in radiation risk assessments (12, 13). Based on this model, three main principles govern radiation protection: the justified use of radiation sources, dose optimization, and minimizing occupational exposure duration (7, 9, 14).
This study was conducted to evaluate intraoperative DAP values across different surgical procedures and anatomical regions and to analyze how factors, such as BMI, age, and gender, influence radiation dose during surgery.
Methods
The study protocol was approved by the Research Ethics Committee of Birjand University of Medical Sciences, Birjand, Iran (IR.BUMS.REC.1402.024).
Initially, factors potentially influencing patient absorbed dose and DAP were categorized. These included patient-specific information (age, gender, BMI, type of surgery, anatomical region of surgery), type of imaging equipment in the operating rooms at Imam Reza Hospital (Orthopedic Operating Room 1, Orthopedic Operating Room 2, and Neurosurgery operating Room), and imaging parameters (kVp, mA, exposure time, number of images, and focus-to-skin distance or FSD).
The population of this descriptive-analytical cross-sectional study consisted of 123 patients who underwent surgery in the operating rooms of the Imam Reza Hospital affiliated with Birjand University of Medical Sciences, Birjand, Iran, and received at least one intraoperative radiographic image. Inclusion criteria required patients to have undergone surgery with a minimum of one radiographic exposure during the procedure. Eligible patients were enrolled in the study after meeting the inclusion criteria. This study did not define any exclusion criteria explicitly.
The researcher carried out data collection. To measure the DAP, a KermaX® plus SDP DAP meter manufactured by IBA was utilized (Figure 1). Initially, data collection forms were prepared, which included all data mentioned previously. All forms were anonymized and did not include patient names.
After data collection, the DAP meter was attached to the output of the C-Arm equipment. The radiation exposure settings were configured to match the recorded parameters, and the corresponding DAP values were then measured. It is important to emphasize that no changes were made to the patients’ imaging protocols. Furthermore, the DAP measurements were conducted without requiring patient presence, ensuring no additional radiation exposure occurred. The DAP meter was an external device and had been calibrated prior to measurements according to the manufacturer’s standards.
The C-arm systems used in this study included: SHIMADZU (Japan) in Orthopedic Operating Room 1, APELEM (France) in Orthopedic Operating Room 2, and EcoRay (South Korea) in the Neurosurgery Room.
Figure 1. DAP meter used to measure DAP values (KermaX plus SDP, manufactured by IBA, Germany)
In this study, descriptive statistics (mean, standard deviation [SD], and range) were calculated for demographic and exposure variables. To test group differences, independent-samples t-tests or ANOVA were applied for normally distributed data. In contrast, non-parametric alternatives (Mann–Whitney U test or Kruskal–Wallis test) were used for non-normal data. Correlation between demographic variables and DAP was assessed using Pearson’s correlation coefficient. All values reported as mean±SD. DAP measurements in µGy·m² unless otherwise specified. The main hypotheses tested were that (1) DAP values differ significantly between orthopedic and neurosurgical operating rooms, (2) DAP values vary according to surgical site (lumbar vs. peripheral regions), and (3) patient-related factors, such as BMI, age, and gender, are significantly associated with DAP values.
Results
Demographic information of participants
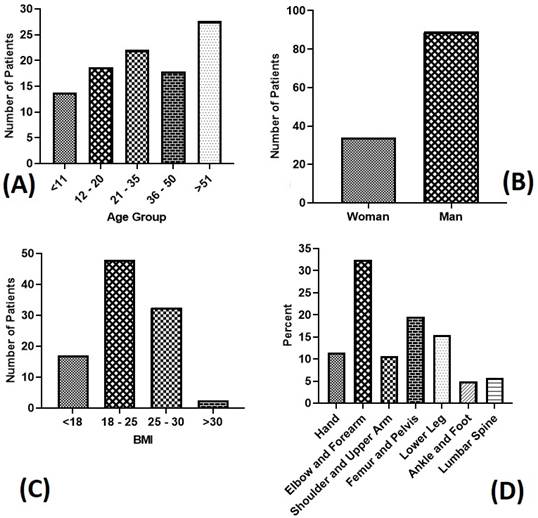
As shown in Table 1 and Figure 2, the present study included 123 participants, the majority of whom were male (n=89, 72.4%). Among the participants, 13.8% (n=17) were younger than 11 years. A total of 18.7% (n=23) were between 12 and 20 years, while 22% (n=27) were between 21 and 35 years. In addition, 17.9% (n=22) were between 36 and 50 years. The remaining participants were older than 50 years. Regarding BMI, most participants (n=59, 47.9%) had values between 15 and 25. In addition, 40 (32.5%) participants were in the 25-30 range, 21(17%) participants had a BMI below 18, and the remaining 3 (2.4%) participants had a BMI above 30. The surgical procedures were performed in the Orthopedic Surgery Room 1 (n=43, 135%), the Orthopedic Surgery Room 2 (n=64, 52.1%), and the Neurosurgery Operating Room (the other procedures), using three different types of C-arm machines. The C-arm machines installed in these operating rooms were as follows: a SHIMADZU (Japan) device in Orthopedics 1, an APELEM (France) device in Orthopedics 2, and an EcoRay (South Korea) device in Neurosurgery.
Results
Demographic information of participants
As shown in Table 1 and Figure 2, the present study included 123 participants, the majority of whom were male (n=89, 72.4%). Among the participants, 13.8% (n=17) were younger than 11 years. A total of 18.7% (n=23) were between 12 and 20 years, while 22% (n=27) were between 21 and 35 years. In addition, 17.9% (n=22) were between 36 and 50 years. The remaining participants were older than 50 years. Regarding BMI, most participants (n=59, 47.9%) had values between 15 and 25. In addition, 40 (32.5%) participants were in the 25-30 range, 21(17%) participants had a BMI below 18, and the remaining 3 (2.4%) participants had a BMI above 30. The surgical procedures were performed in the Orthopedic Surgery Room 1 (n=43, 135%), the Orthopedic Surgery Room 2 (n=64, 52.1%), and the Neurosurgery Operating Room (the other procedures), using three different types of C-arm machines. The C-arm machines installed in these operating rooms were as follows: a SHIMADZU (Japan) device in Orthopedics 1, an APELEM (France) device in Orthopedics 2, and an EcoRay (South Korea) device in Neurosurgery.
Table 1. Frequency distribution of demographic variables among the study participants
| variable |
| N | Percent | ||
| Gender | Male | 89 | 72.4 |
| Female | 34 | 27.6 | |
| Age | <11 | 17 | 13.8 |
| 12-20 | 23 | 18.7 | |
| 21-35 | 27 | 22.0 | |
| 36-50 | 22 | 17.9 | |
| >51 | 34 | 27.6 | |
| Operating Room | Orthopedic 1 | 43 | 35.0 |
| Orthopedic 2 | 64 | 52.0 | |
| Nerves | 16 | 13.0 | |
| BMI | <18 | 21 | 17 |
| 18-25 | 59 | 47.9 | |
| 25-30 | 40 | 32.5 | |
| >30 | 3 | 2.4 |
Figure 2. Demographic characteristics of the study participants. (A) Distribution of patients across different age groups. (B) Number of male and female patients. (C) Patient distribution by BMI categories. (D) Percentage of anatomical distribution of the surgical procedures.
The anatomical distribution of the surgical procedures was as follows: 11.4% (14 surgeries) involved the hands, 32.5% (40 surgeries) the elbow and forearm, 15.4% (19 surgeries) the shoulder and upper arm, 5.7% (7 surgeries) the lumbar spine, 19.5% (24 surgeries) the femur and pelvis, 15.4% (19 surgeries) the lower leg, 4.9% (6 surgeries) the ankle and foot.
Considering the anatomical distribution of the surgical procedures, a total of 14 surgeries (11.4%) involved the hands, while 40 surgeries (32.5%) were performed on the elbow and forearm. Another 19 surgeries (15.4%) involved the shoulder and upper arm, and 7 surgeries (5.7%) were on the lumbar spine. In addition, 24 surgeries (19.5%) were performed on the femur and pelvis, 19 surgeries (15.4%) on the lower leg, and 6 surgeries (4.9%) on the ankle and foot.
Mean DAP values for patients undergoing orthopedic and neurosurgical procedures
Orthopedic procedures were performed in two operating rooms, and imaging was performed using two different C-arm machines. The number of procedures in Orthopedic Operating Room 2 was higher than that in Orthopedic Operating Room 1. The mean DAP value in Orthopedic Operating Room 1 was 0.96±0.66 µGy·m² (range: 0.30-1.62 µGy·m²) with an average exposure time of 4.73±0.74 seconds. In the Orthopedic Operating Room 2, the mean DAP was 1.67±1.22 µGy·m² (range: 0.45-2.89 µGy·m²) with an average exposure time of 4.45±2.08 seconds. The mean number of images per patient was 8.00±8.58 in Orthopedic Operating Room 1 and 38.04±7.50 in Orthopedic Operating Room 2. For neurosurgical procedures, the mean DAP value was 33.27±15.89 µGy·m², with an average exposure time of 1.93±1.20 seconds and an average of 6.5±3.78 images obtained per patient.
A statistically significant difference (P<0.001) was observed between mean DAP values in neurosurgery versus both Orthopedic Operating Rooms. However, no significant difference was found between Orthopedic Operating Room 1 and Orthopedic Operating Room 2 (P=0.37). Although the mean number of radiographs was substantially higher in Orthopedic Operating Room 2, compared to Orthopedic Operating Room 1, the statistical test did not confirm significance (P=0.46). This is likely due to the significant variance in the Orthopedic Operating Room 1 data and the relatively small sample size, which reduced the statistical power.
Therefore, the observed difference should be interpreted with caution and may still be clinically relevant despite the lack of statistical significance. Significant differences in X-ray exposure times were noted between neurosurgery and both Orthopedic Operating Rooms (P<0.001), but not between Orthopedic Operating Room 1 and Orthopedic Operating Room 2 (P=1.00).
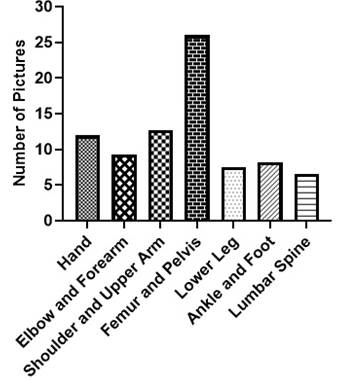
As shown in Figure 3, anatomical regions demonstrated varying image counts: wrist/hand (11.92 images), forearm/elbow (9.31 images), shoulder/upper arm (12.69 images), lower leg (7.52 images), and ankle/foot (8.16 images) procedures.
Considering the anatomical distribution of the surgical procedures, a total of 14 surgeries (11.4%) involved the hands, while 40 surgeries (32.5%) were performed on the elbow and forearm. Another 19 surgeries (15.4%) involved the shoulder and upper arm, and 7 surgeries (5.7%) were on the lumbar spine. In addition, 24 surgeries (19.5%) were performed on the femur and pelvis, 19 surgeries (15.4%) on the lower leg, and 6 surgeries (4.9%) on the ankle and foot.
Mean DAP values for patients undergoing orthopedic and neurosurgical procedures
Orthopedic procedures were performed in two operating rooms, and imaging was performed using two different C-arm machines. The number of procedures in Orthopedic Operating Room 2 was higher than that in Orthopedic Operating Room 1. The mean DAP value in Orthopedic Operating Room 1 was 0.96±0.66 µGy·m² (range: 0.30-1.62 µGy·m²) with an average exposure time of 4.73±0.74 seconds. In the Orthopedic Operating Room 2, the mean DAP was 1.67±1.22 µGy·m² (range: 0.45-2.89 µGy·m²) with an average exposure time of 4.45±2.08 seconds. The mean number of images per patient was 8.00±8.58 in Orthopedic Operating Room 1 and 38.04±7.50 in Orthopedic Operating Room 2. For neurosurgical procedures, the mean DAP value was 33.27±15.89 µGy·m², with an average exposure time of 1.93±1.20 seconds and an average of 6.5±3.78 images obtained per patient.
A statistically significant difference (P<0.001) was observed between mean DAP values in neurosurgery versus both Orthopedic Operating Rooms. However, no significant difference was found between Orthopedic Operating Room 1 and Orthopedic Operating Room 2 (P=0.37). Although the mean number of radiographs was substantially higher in Orthopedic Operating Room 2, compared to Orthopedic Operating Room 1, the statistical test did not confirm significance (P=0.46). This is likely due to the significant variance in the Orthopedic Operating Room 1 data and the relatively small sample size, which reduced the statistical power.
Therefore, the observed difference should be interpreted with caution and may still be clinically relevant despite the lack of statistical significance. Significant differences in X-ray exposure times were noted between neurosurgery and both Orthopedic Operating Rooms (P<0.001), but not between Orthopedic Operating Room 1 and Orthopedic Operating Room 2 (P=1.00).
As shown in Figure 3, anatomical regions demonstrated varying image counts: wrist/hand (11.92 images), forearm/elbow (9.31 images), shoulder/upper arm (12.69 images), lower leg (7.52 images), and ankle/foot (8.16 images) procedures.
Figure 3. The highest number of images was obtained during femur and pelvis procedures (25.96 images), while the fewest were taken during lumbar spinal surgeries (6.5 images).
Comparison of DAP Values by Anatomical Site and Operating Room
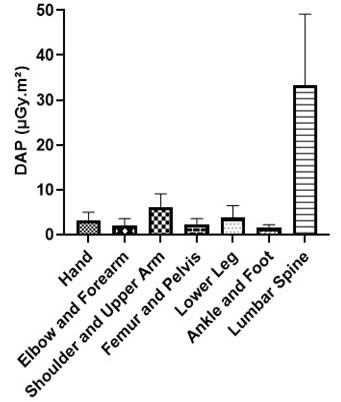
The lowest mean DAP values were observed in the ankle/foot region (1.46 ± 0.77 μGy·m², range: 0.69–2.23 μGy·m²), while the highest were recorded in the lumbar region (33.27 ± 15.89 μGy·m²) (Figure 4). A statistically significant association was found between DAP values across different anatomical regions (P<0.001). After controlling for age and BMI, Table 2 shows that the mean DAP for wrist/hand procedures was 21.6 μGy·m² lower than that for lumbar procedures. The corresponding reductions for other regions relative to the lumbar site were: elbow/forearm (22.2 μGy·m²), pelvis/femur (20.8 μGy·m²), lower leg (22.2 μGy·m²), ankle/foot (22.05 μGy·m²), and arm/shoulder (21.36 μGy·m²). These findings confirm that lumbar surgeries require significantly higher DAP, compared to other anatomical regions.
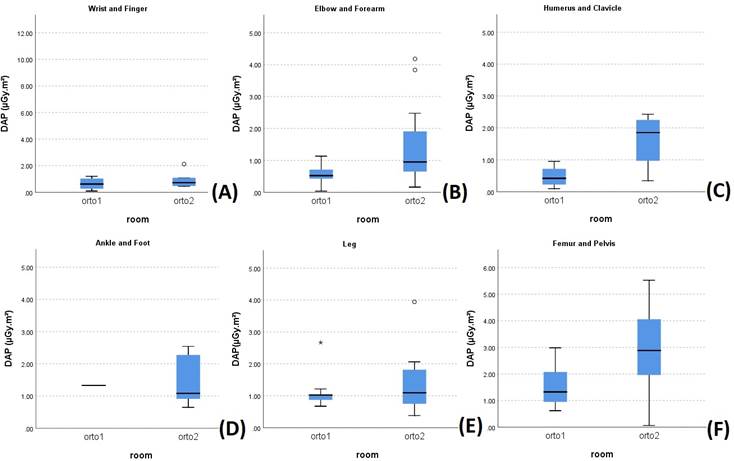
Since lumbar procedures were performed in the Neurosurgery Operating Room, while surgeries involving other anatomical regions were carried out in Orthopedic Operating Rooms 1 and 2, the model also explains the observed differences in DAP values between Neurosurgical and Orthopedic Operating Rooms. Figure 5 further compares the DAP values between Orthopedic Operating Rooms 1 and 2 stratified by surgical site. Although the types of procedures performed were similar, the imaging equipment in Orthopedic Operating Room 2 consistently delivered higher DAP values and radiation exposure, compared to Orthopedic Operating Room 1, for comparable anatomical regions.
The lowest mean DAP values were observed in the ankle/foot region (1.46 ± 0.77 μGy·m², range: 0.69–2.23 μGy·m²), while the highest were recorded in the lumbar region (33.27 ± 15.89 μGy·m²) (Figure 4). A statistically significant association was found between DAP values across different anatomical regions (P<0.001). After controlling for age and BMI, Table 2 shows that the mean DAP for wrist/hand procedures was 21.6 μGy·m² lower than that for lumbar procedures. The corresponding reductions for other regions relative to the lumbar site were: elbow/forearm (22.2 μGy·m²), pelvis/femur (20.8 μGy·m²), lower leg (22.2 μGy·m²), ankle/foot (22.05 μGy·m²), and arm/shoulder (21.36 μGy·m²). These findings confirm that lumbar surgeries require significantly higher DAP, compared to other anatomical regions.
Since lumbar procedures were performed in the Neurosurgery Operating Room, while surgeries involving other anatomical regions were carried out in Orthopedic Operating Rooms 1 and 2, the model also explains the observed differences in DAP values between Neurosurgical and Orthopedic Operating Rooms. Figure 5 further compares the DAP values between Orthopedic Operating Rooms 1 and 2 stratified by surgical site. Although the types of procedures performed were similar, the imaging equipment in Orthopedic Operating Room 2 consistently delivered higher DAP values and radiation exposure, compared to Orthopedic Operating Room 1, for comparable anatomical regions.
Figure 4. Mean±SD of DAP values measured across different anatomical regions. The lowest mean DAP values were observed in the ankle/foot region (1.46 ± 0.77 μGy·m², range: 0.69-2.23 μGy·m²), while the highest values were recorded in the lumbar region (33.27 ± 15.89 μGy·m²).
Comparison of DAP values between Orthopedic Operating Rooms 1 and 2 by Surgical Site
Given that the types of procedures performed in Orthopedic Operating Rooms 1 and 2 were similar, Figure 5 compares the DAP values between these two operating rooms stratified by surgical site. Despite their similar clinical applications, the imaging equipment in Orthopedic Operating Room 2 delivered significantly higher DAP values and radiation exposure, compared to Orthopedic Operating Room 1, for comparable procedures.
Association between Demographic Variables (BMI, Age, and Gender) and DAP Values Body Mass Index (BMI):
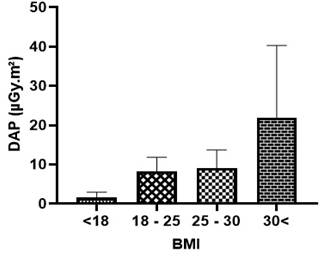
As shown in Figure 6, the lowest mean DAP values were observed in patients with BMI <18 (1.53±1.38 μGy·m², range: 0.15–2.91 μGy·m²). For BMI categories 18–25 and 25–30, the mean DAP values were 3.52±8.26 μGy·m² and 4.61±9.09 μGy·m², respectively. The highest DAP values were recorded in patients with BMI >30 (18.43±21.84 μGy·m², range: 3.41–40.27 μGy·m²). A statistically significant association was found between DAP values and BMI (P=0.023).
Given that the types of procedures performed in Orthopedic Operating Rooms 1 and 2 were similar, Figure 5 compares the DAP values between these two operating rooms stratified by surgical site. Despite their similar clinical applications, the imaging equipment in Orthopedic Operating Room 2 delivered significantly higher DAP values and radiation exposure, compared to Orthopedic Operating Room 1, for comparable procedures.
Association between Demographic Variables (BMI, Age, and Gender) and DAP Values Body Mass Index (BMI):
As shown in Figure 6, the lowest mean DAP values were observed in patients with BMI <18 (1.53±1.38 μGy·m², range: 0.15–2.91 μGy·m²). For BMI categories 18–25 and 25–30, the mean DAP values were 3.52±8.26 μGy·m² and 4.61±9.09 μGy·m², respectively. The highest DAP values were recorded in patients with BMI >30 (18.43±21.84 μGy·m², range: 3.41–40.27 μGy·m²). A statistically significant association was found between DAP values and BMI (P=0.023).
Table 2. Comparison of mean DAP values between the lumbar region and other anatomical sites after adjusting for age and BMI effects
| Differences in anatomical regions | Hand | Elbow /Forearm | Arm/Shoulder | Ankle/ Foot | Lower Leg | Femur/ Pelvis |
| DAP differences compared to the lumbar region (µGy.m²) | -21.64 | -22.28 | -21.63 | -22.05 | -22.22 | -20.81 |
| P-value | 0.00 | 0.00 | 0.00 | 0.00 | 0.00 | 0.00 |
Comparison of DAP values between Orthopedic Operating Rooms 1 and 2 by Surgical Site
Given that the types of procedures performed in Orthopedic Operating Rooms 1 and 2 were similar, Figure 5 compares the DAP values between these two operating rooms stratified by surgical site. Despite their similar clinical applications, the imaging equipment in Orthopedic Operating Room 2 delivered significantly higher DAP values and radiation exposure, compared to Orthopedic Operating Room 1, for comparable procedures.
Association between Demographic Variables (BMI, Age, and Gender) and DAP Values
Body Mass Index (BMI):
As shown in Figure 6, the lowest mean DAP values were observed in patients with BMI <18 (1.53±1.38 μGy·m², range: 0.15–2.91 μGy·m²). For BMI categories 18–25 and 25–30, the mean DAP values were 3.52±8.26 μGy·m² and 4.61±9.09 μGy·m², respectively. The highest DAP values were recorded in patients with BMI >30 (18.43±21.84 μGy·m², range: 3.41–40.27 μGy·m²). A statistically significant association was found between DAP values and BMI (P=0.023).
Figure 5. Mean DAP values in Orthopedic Operating Rooms 1 and 2 by surgical site. (A) to (F), respectively represent mean DAP values for imaging of the following anatomical regions: (A) Hand, (B) Elbow and forearm, (C) upper arm and shoulder, (D) Ankle and foot, (E) Leg, and (F) Femur and pelvis.
Figure 6. The lowest mean DAP values were observed in patients with BMI <18 (1.38±1.53 μGy·m²). For BMI categories 18-25, 25-30, and >30, the mean DAP values were 3.52±8.26 μGy·m², 4.61±9.09 μGy·m², and 18.43±21.84 μGy·m², respectively.
Age
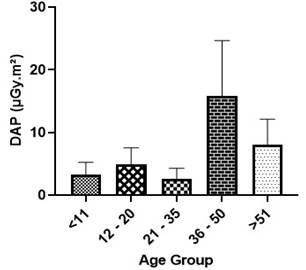
As illustrated in Figure 7 and Table 3, the highest DAP values were measured in the 36–50 age group (mean: 15.80±8.86 μGy·m²; range: 6.94–24.66 μGy·m²), while the lowest values were observed in the 21–35 age group (mean: 2.58±1.70 μGy·m²). The mean DAP values for age groups <11 years and 12–20 years were 3.23±1.99 μGy·m² and 4.88±2.67 μGy·m², respectively. No statistically significant difference was found in DAP values across age groups (P=0.077).
Figure 7. Mean±SD of measured DAP values across different age groups.
Gender
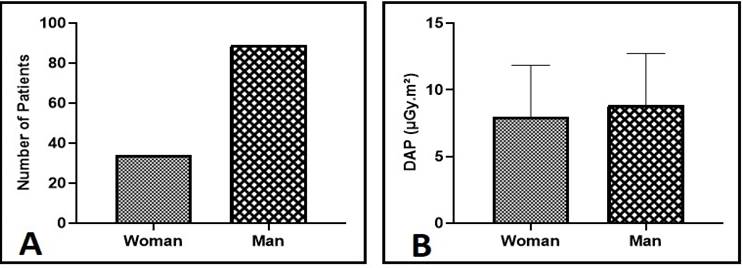
As shown in Figure 8, the majority of patients in the study were male. The mean DAP values were 8.84±3.88 μGy·m² (range: 4.96–12.72 μGy·m²) in males and 7.97±3.86 μGy·m² (range: 4.11–11.83 μGy·m²) in females. No statistically significant difference was observed between males and females in terms of DAP values (P=0.556).
Table 3. Mean±SD of measured DAP values across different age groups
| Age (year) | <11 | 12 - 20 | 21 - 35 | 36 - 50 | >51 | P-value | |
| DAP (µGy.m²) |
Mean ± SD | 3.23 ± 1.99 | 4.88 ± 2.67 | 2.58 ± 1.70 | 15.80 ± 8.86 | 7.99 ± 4.12 | 0.077 |
| QR2 (QR1-QR3) |
0.87 (0.59-1.12) | 1.02 (0.87-2.27) | 1.20 (0.48-2.03) | 1.56 (1.03-5.10) | 2.05 (0.63-3.95) | ||
Figure 8. The study included 123 patients, comprising 89 males (72.4%) and 34 females (27.6%). Mean DAP values were 3.88±8.84 μGy·m² (range: 4.96-12.72 μGy·m²) in male patients and 3.86±7.97 μGy·m² (range: 4.11-11.83 μGy·m²) in female patients.
Discussion
This study evaluated 123 patients, of whom 89 were male and 34 were female. In Orthopedic Operating Room 1, the mean DAP was 0.96±0.66 μGy·m² with an average exposure time of 4.73±0.74 seconds, while in Orthopedic Operating Room 2, the mean DAP was higher at 1.67±1.22 μGy·m² (exposure time: 4.45±2.08 seconds). These findings contrast significantly with those of Lee et al. (2015) (19), who reported a mean DAP of 0.27±0.57 mGy·m² despite substantially longer exposure times (78.53 seconds). Notably, our values were markedly lower, with Orthopedic Room 1 showing 281.25-fold lower and Orthopedic Room 2 showing 161.67-fold lower DAP values than those reported by Lee et al.
In neurosurgical procedures, the mean DAP was 33.27±15.89 μGy·m² with an average exposure time of 1.93±1.20 seconds. By comparison, Lee et al. (2015) (19) reported 0.95±0.94 mGy·m² with an exposure time of 82.43 seconds, which was 28.55-fold higher than our neurosurgical values. Overall, a statistically significant difference (P<0.001) was observed between DAP values in Orthopedic Operating Rooms 1 and 2 and the Neurosurgery Operating Room. This discrepancy is clinically justified, as lumbar procedures (predominantly performed in the Neurosurgery Operating Room) inherently require higher DAP than peripheral orthopedic cases. Greater tissue density in spinal anatomy necessitates increased radiation, and most neurosurgical interventions targeted the lumbar region, whereas orthopedic cases mainly involved the extremities.
In addition to surgical site differences, patient-specific factors, such as BMI, significantly influenced DAP values. Our results demonstrated that DAP increased with BMI (P=0.023): BMI <18, 1.38±1.53 μGy·m²; BMI 18–25, 3.52±8.26 μGy·m²; BMI 25–30, 4.61±9.09 μGy·m²; BMI >30, 18.43±21.84 μGy·m². A strong correlation (r=0.49, P=0.01) was observed between BMI and DAP in pelvic/femoral procedures, consistent with Baratz et al. (20) (r=0.45, P<0.001) and Bratschitsch et al. (2019) (21) (r=0.80, P=0.01). These findings confirm that patient habitus is a critical determinant of radiation exposure during intraoperative imaging.
By contrast, no significant age-dependent variation in DAP was found in this study (P=0.077). The highest values occurred in the 36–50-year age group (15.80±8.86 μGy·m²), while the lowest were in the 21–35-year group (2.58±1.70 μGy·m²). Values for patients younger than 11 years and those aged 12–20 years were 3.23±1.99 μGy·m² and 4.88±2.67 μGy·m², respectively. These results differ from those reported by Ghayoursaffar (2023) (1), Billinger (22), and Roch (2012) (23); however, they are in line with the findings of Baratz et al (20) (multivariate coefficient: 1.8, P=0.56). The discrepancy may be explained by the fact that the former studies primarily focused on pediatric populations, in which age has a more substantial influence on anatomy and radiation absorption.
Taken together, our findings underscore the importance of carefully optimizing radiation dose while maintaining image quality. Since no universal DAP standards exist for intraoperative radiography, dose management should consider patient-specific factors, such as body habitus, surgical site, and equipment performance. Implementing dose-reduction protocols, adjusting field size, and using protective measures remain essential strategies to minimize unnecessary exposure for both patients and operating room staff.
Conclusions
This study provides valuable insights aimed at enhancing surgeons’ awareness and reducing their exposure to ionizing radiation. The findings indicate that factors, such as the anatomical site of surgery, patients' BMI, and the type of surgical procedure significantly influence the average DAP. It is highly recommended that, particularly during procedures involving the spinal cord, pelvis, or femur, surgical team members utilize protective measures, such as wearing lead aprons or positioning themselves behind lead shields whenever feasible.
Given the potential health risks associated with intraoperative radiation exposure, surgical personnel must be adequately informed and adopt effective protective strategies. The routine use of personal dosimeters is strongly advised for accurate monitoring and dose optimization. Moreover, surgeons bear the responsibility of ensuring comprehensive radiation protection protocols are in place for both patients and operating room staff.
Acknowledgments
The authors gratefully acknowledge all research team members for their contributions.
Funding
This research was fully funded by Birjand University of Medical Sciences, Birjand, Iran.
Conflict of Interest
The authors declare that there is no conflict of interest.
Type of Study: Research |
Subject:
Orthopedia
Received: 2025/06/7 | Accepted: 2025/09/13 | ePublished ahead of print: 2025/09/18 | Published: 2025/09/18
Received: 2025/06/7 | Accepted: 2025/09/13 | ePublished ahead of print: 2025/09/18 | Published: 2025/09/18
References
1. Ghayour-Saffar N, Ehsanbakhsh A, Keshtkar M, Pandesh S. Evaluation of DAP Values Obtained from Chest X-rays in Children under 12 Years of Age Referred to Educational Hospitals of Birjand University of Medical Sciences in 2020. Frontiers Biomed Technol. 2022;9(3):185-90. [DOI:10.18502/fbt.v9i3.9644]
2. Majidi H, Bani Mostafavi ES, Younesi M. Comparing the Diagnostic Value of MRU and CT Scan in Diagnosing the Etiology and Severity of Urinary Tract Obstruction in Patients With Renal Colic. J Mazandaran Univ Med Sci. 2012;22(95):66-73.
3. Gharib M, Mohammadi S, Mohammadi M, Maghbouli N, Nabian MH. Challenges of Using C-Arm Fluoroscopy Systems: A Mixed Method Study Investigating Orthopedic Surgeons' Experience. J Iran Med Counc. 2024;7(2):344-50. [DOI:10.18502/jimc.v7i2.15047]
4. Biswas D, Bible JE, Whang PG, Simpson AK, Grauer JN. Sterility of C-arm fluoroscopy during spinal surgery. Spine. 2008;33(17):1913-7. [DOI:10.1097/BRS.0b013e31817bb130]
5. Javadzadeh, A., Alipour, H. Knowledge of General Dentists about Radiation Protection in Oral Radiographic Examinations in the City of Rasht-Iran in 2009. J Mashhad Dent Sch. 2011; 35(1): 23-32.
6. Sadetzki S, Mandelzweig L. Childhood exposure to external ionising radiation and solid cancer risk. Br J Cancer.2009;100(7):1021-5. [DOI:10.1038/sj.bjc.6604994]
7. Ahmad D, Almatari M, Tumayhi M, Alanazi W, Shrefan M, Agealy W, et al. Occupational Exposure of Scatter Radiation and Proper Protective Methods. J Healthc Sci . 2022;2(11):443-8. [DOI:10.52533/JOHS.2022.21117]
8. Lee WH, Nguyen PK, Fleischmann D, Wu JC. DNA damage-associated biomarkers in studying individual sensitivity to low-dose radiation from cardiovascular imaging. Eur Heart J. 2016;37(40):3075-80. [DOI:10.1093/eurheartj/ehw206]
9. Salama KF, AlObireed A, AlBagawi M, AlSufayan Y, AlSerheed M. Assessment of occupational radiation exposure among medical staff in health-care facilities in the Eastern Province, Kingdom of Saudi Arabia. Indian J Occup Environ Med. 2016;20(1):21-5. [DOI:10.4103/0019-5278.183832]
10. Allahveysi F, Mahmoodi M, Elahimanesh F, Parvizpoor S. Common X-ray machine quality control in hospitals affiliated with Kurdistan University of Medical Sciences. SJNMP. 2016;2(2):58-72. [DOI:10.29252/sjnmp.2.2.58]
11. Mettler Jr FA, Huda W, Yoshizumi TT, Mahesh M. Effective doses in radiology and diagnostic nuclear medicine: a catalog. Radiology. 2008;248(1):254-63. [DOI:10.1148/radiol.2481071451]
12. Yanovskiy M, Shaki YY, Socol Y. Ethics of adoption and use of the linear no-threshold model. Dose-Response. 2019;17(1):1559325818822602. [DOI:10.1177/1559325818822602]
13. Laurier D, Billarand Y, Klokov D, Leuraud K. The scientific basis for the use of the linear no-threshold (LNT) model at low doses and dose rates in radiological protection. J Radiol Prot. 2023;43(2):024003. [DOI:10.1088/1361-6498/acdfd7]
14. Vano E, Kleiman NJ, Duran A, Rehani MM, Echeverri D, Cabrera M. Radiation cataract risk in interventional cardiology personnel. Radiat Res. 2010;174(4):490-5. [DOI:10.1667/RR2207.1]
15. Lee YS, Lee HK, Cho JH, Kim HG. Analysis of radiation risk to patients from intra-operative use of the mobile X-ray system (C-arm). J Res Med Sci. 2015;20(1):7-12.
16. Baratz MD, Hu YY, Zurakowski D, Appleton P, Rodriguez EK. The primary determinants of radiation use during fixation of proximal femur fractures. Injury. 2014;45(10):1614-9. [DOI:10.1016/j.injury.2014.05.010]
17. Bratschitsch G, Leitner L, Stücklschweiger G, Guss H, Sadoghi P, Puchwein P, et al. Radiation exposure of patient and operating room personnel by fluoroscopy and navigation during spinal surgery. Sci Rep. 2019;9(1):17652. [DOI:10.1038/s41598-019-53472-z]
18. Billinger J, Nowotny R, Homolka P. Diagnostic reference levels in pediatric radiology in Austria. Eur Radiol. 2010;20(7):1572-9. [DOI:10.1007/s00330-009-1697-7]
19. Roch P, Aubert B. French diagnostic reference levels in diagnostic radiology, computed tomography and nuclear medicine: 2004-2008 review. Radiat Prot Dosim. 2013;154(1):52-75. [DOI:10.1093/rpd/ncs152]
Send email to the article author
| Rights and permissions | |
 |
This work is licensed under a Creative Commons Attribution-NonCommercial 4.0 International License. |

Attribution-NoneCommercial CC BY-NC
